
Key takeaways
- IEEE 1789 is a recommended practice, not a mandatory certification. It asks two things: modulation frequency at or above 100Hz, and percent flicker kept under a line that rises with that frequency. The normal-population low-risk line is percent flicker at or below frequency times 0.08; the stricter no-observable-effect line for sensitive populations is frequency times 0.0333. If the frequency cannot be determined, percent flicker is held to 10 percent. At 120Hz the low-risk cap works out to about 10 percent; at 1250Hz and above, even 100 percent flicker sits outside the region the standard considers harmful.
- Percent flicker and flicker index are not interchangeable, and neither one tells the whole story. Percent flicker is 100 times (max minus min) over (max plus min); it captures the peak-to-peak modulation but says nothing about waveform or frequency. Flicker index is an area ratio from 0 to 1 that accounts for waveform and duty cycle but still ignores frequency. Two products can print an identical percent flicker and present very different risk, which is exactly why IEEE 1789 plots percent flicker against frequency instead of quoting a single number.
- PstLM and SVM are the newer metrics built on models of human perception. CIE TN 006 set the framework for temporal light artefacts, and IEC TR 61547-1 defines PstLM, the light-flickermeter short-term indicator. PstLM equal to 1 means the average observer has roughly a 50 percent chance of detecting flicker; the European Ecodesign Regulation 2019/2020 requires PstLM at or below 1.0 at full load for light sources placed on the EU market, with limited exemptions. SVM, the stroboscopic visibility measure, describes the effect seen on moving objects, and the same regulation sets a binding SVM cap of 0.4 at full load for LED and OLED light sources, with stated exemptions for high-output HID and sources intended for outdoor, industrial or other applications where standards allow a CRI below 80.
- Flicker is decided by the driver, not the LED chip. AC LEDs, drivers with thin or inadequate capacitors, lamps on cheap electronic transformers, phase-cut TRIAC dimming and low-frequency PWM are the configurations most likely to modulate, and flicker almost always gets worse as the light is dimmed, not better. A steady driver at full brightness is the easy part; a product that stays clean through the entire dimming range is the real test. High-frequency constant-current design and adequate ripple filtering, or PWM moved above the visual thresholds, are what separate the two.
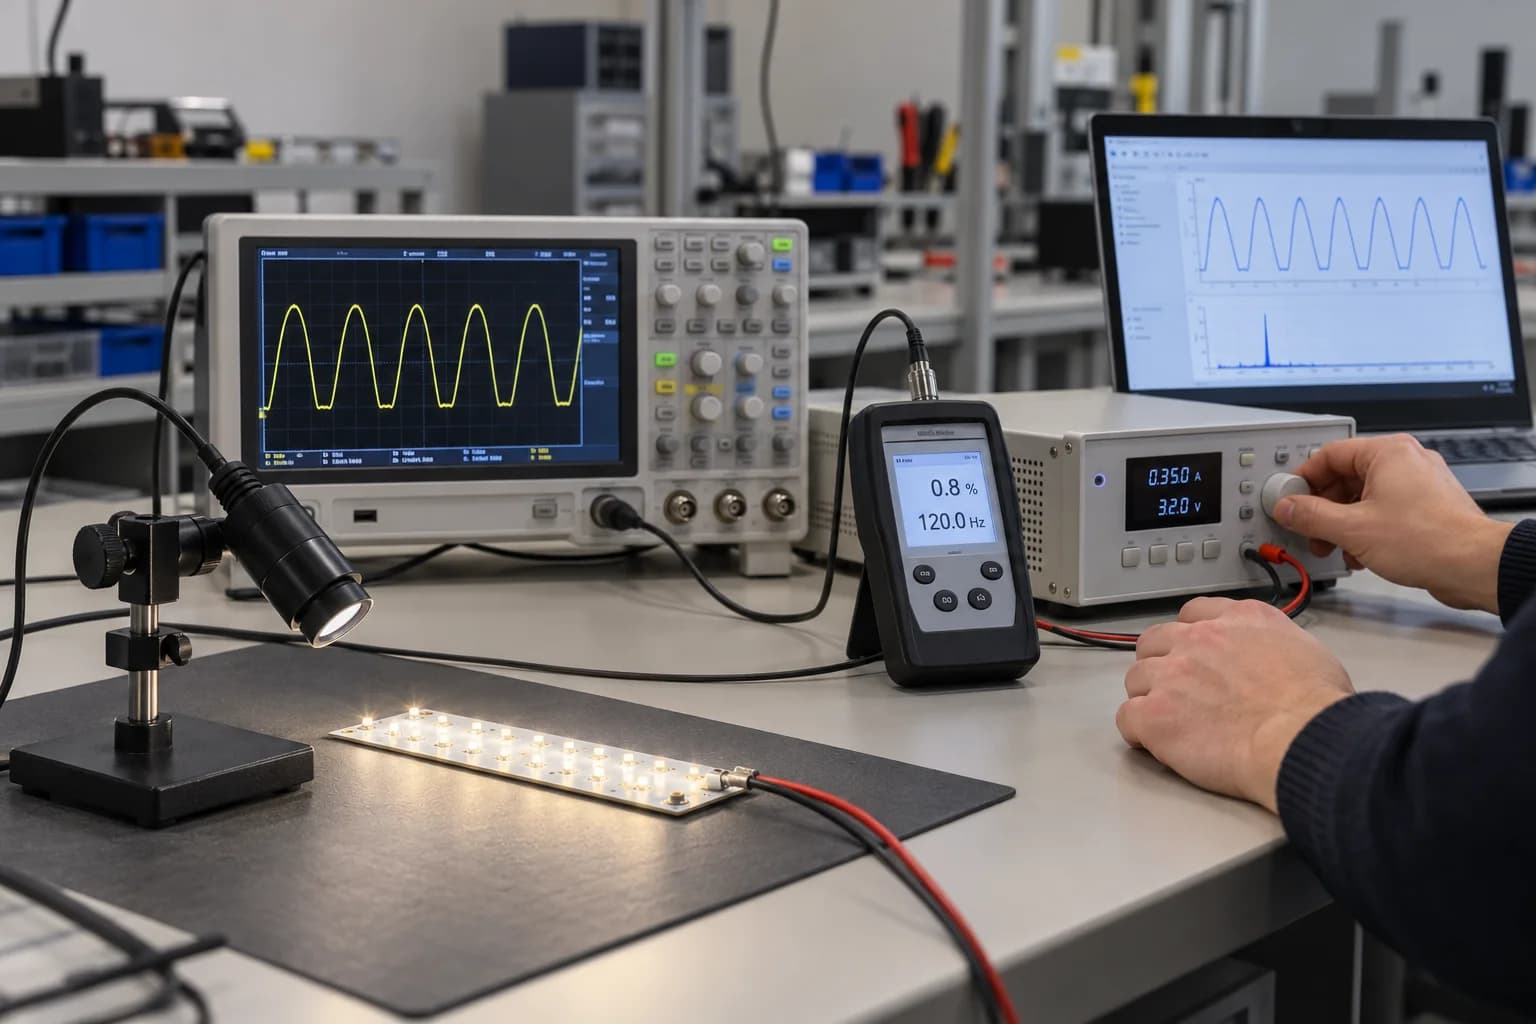
- Verify the light output, not the marketing label. Flicker free has no single legal definition and most datasheets do not publish a waveform. In a lab, a photometric probe or photodiode is pointed at the LED board and fed to an oscilloscope or a dedicated flicker meter that reads the optical waveform and reports percent flicker, frequency, PstLM and SVM, and the test is repeated across the dimming range, not just at full output. Quick field checks - a flicker wheel or spinning top, a phone camera, or waving fingers under the light to look for phantom array - are comparative, not quantitative, and anything filmed for video or conferencing needs tighter numbers because a camera samples more aggressively than the eye.
1. What flicker actually is: flicker, stroboscopic effect, phantom array
The word flicker gets used loosely for three different things, and CIE TN 006 separates them because they are measured differently. Flicker itself is the perception that a light source is changing in intensity while neither the source nor the viewer is moving. The stroboscopic effect is the same modulation revealed by a moving object under a stationary eye - machinery, wheels, a pen waved through the beam. The phantom array effect is the reverse, the ghosting seen when the eye moves across a steady modulated source, often in peripheral vision. A buyer asking for no flicker usually wants all three controlled, not just the first.
It is tempting to think LEDs made lighting steadier, and at the chip they are fast. That speed is also what makes modulation possible. An incandescent filament or a halogen lamp has thermal inertia, so even though it is powered by an alternating current that crosses zero 100 or 120 times a second, the filament cannot cool in that window and the output smooths out. An LED responds in microseconds and follows its drive current faithfully; if the driver delivers a current that ripples, pulses or switches on and off, the light output does the same, with nothing to mask it. Flicker moved from the lamp to the power supply.
The health language around this deserves care. For the overwhelming majority of people the consequences are mild and cumulative: eyestrain, headaches, fatigue, reduced performance on visual tasks, and a general sense that a space is uncomfortable without being able to say why. A small minority with photosensitive epilepsy can be affected by visible flashing in specific low-frequency ranges, which is why standards treat the region under about 100Hz so seriously. The honest framing for a procurement decision is comfort and task performance across long hours, with the seizure risk confined to a well-defined frequency band the standards explicitly close off.
The part that catches buyers out is that flicker at twice the mains frequency - 100Hz or 120Hz - is close to the edge of conscious perception. Walk into a room and you may not see anything, because the modulation is fast enough to be processed but not fast enough to be obvious. You notice it indirectly, as fatigue, or through a camera viewfinder, or when you wave a hand under it. A visual inspection where an inspector stands still and looks up is simply not a test.
2. What IEEE 1789 recommends: frequency, percent flicker, and the two lines
The work began in 2008, when IEEE formed a standards group - chaired by Brad Lehman, with contributions from lighting researchers including those who would later publish the Lehman and Wilkins papers on designing to mitigate flicker - and the recommended practice was released in 2015. It is worth being precise about what the document is. IEEE 1789 is a recommended practice, engineering guidance based on a review of the health research. It is not a certification mark, and there is no logo or third-party certificate for it. When a supplier says a product is IEEE 1789 compliant, that is a claim about measured values, not a certificate a body has issued.
The heart of the standard is a graph. The horizontal axis is the modulation frequency in hertz; the vertical axis is percent flicker, also called percent modulation. Two boundary lines slope upward. Below the lower line is the no-observable-effect region, the level the standard considers safe even for unusually sensitive people, which corresponds to percent flicker at or below frequency times 0.0333. Below the upper line is the low-risk region for the general population, percent flicker at or below frequency times 0.08. Above the upper line the standard flags possible risk. The lines slope upward because faster modulation is harder to perceive and less biologically consequential, so a little more depth is tolerated as frequency rises.
Two practical rules fall out of the graph. The first is a floor: the modulation frequency should be at or above 100Hz. The second is the depth cap, chosen against the population the space serves - frequency times 0.08 for a normal population, frequency times 0.0333 where a project serves or is accessible to sensitive groups. When the frequency cannot be determined reliably, the standard says percent flicker shall not exceed 10 percent, a conservative default that avoids the need to read the graph.
Two worked examples make the numbers concrete. At a modulation frequency of 120Hz, the low-risk cap is 120 times 0.08, or 9.6, rounded up to 10 percent; the no-effect cap is 120 times 0.0333, roughly 4 percent. A typical cheap product on a simple driver can run far above this, at tens of percent modulation. At a frequency of 1250Hz and above, the upper line reaches 100 percent, so the standard places no restriction on depth - a useful fact for designers, because it shows the recommended route is usually to push modulation frequency up rather than to chase a perfectly flat current at low frequency. The graph rewards frequency far more than it rewards depth.
3. Percent flicker versus flicker index: why one number is not enough
The older metrics were defined by the IES and are still the ones most often quoted, so a buyer should know both. Percent flicker is the simpler ratio: 100 times (maximum minus minimum) divided by (maximum plus minimum). It is a 0 to 100 percent measure of the peak-to-peak modulation around the average, and it is the number that maps to the vertical axis of IEEE 1789. It is easy to measure from a waveform and widely understood, but it is deliberately blind to everything except amplitude. It does not see frequency, waveform shape or duty cycle.
Flicker index was designed to address the shape problem. It is a ratio of areas on a single cycle - the area under the curve above the average light level, divided by the total area under the curve - running from 0 to 1.0. Because it uses the area above average rather than just the peaks, it responds to the shape of the waveform and the fraction of the cycle spent at each level. A sharp narrow pulse and a smooth shallow ripple with the same peak-to-peak amplitude produce different flicker index values. What the index still does not include is frequency; it was built around line-frequency waveforms and is most interpretable there.
The gap between the two metrics is where a single printed number misleads. Two products can show the same percent flicker and differ completely in how often they modulate and how the light spends its cycle. One can sit at a harmless high frequency and the other at a tiring low frequency, both printing 30 percent. Conversely two products can be tuned to the same percent flicker with different waveforms and reach the eye differently. Neither metric on its own carries the frequency dimension, which is the whole reason IEEE 1789 plots them together rather than declaring that a percent flicker under some fixed value is always safe.
What this means for a spec is that you should ask for the pair, plus the frequency. A datasheet that gives only percent flicker, or only flicker index, is asking you to fill in the missing variable yourself. Percent flicker locates the vertical position on the IEEE 1789 graph, the modulation frequency locates the horizontal, and the point only has meaning once both are known.
The rest of this guide concentrates on the standard itself, the newer perception-based metrics, and the legal limits. If you want a camera-first, hands-on look at percent flicker and flicker index - why a phone shows the bands and how to catch a bad product without a lab - our measurement-focused companion article covers that ground.
4. PstLM and SVM: the metrics regulators and DLC now use
Useful as the IEEE 1789 graph is for engineers, it is a simplification. Human perception of flicker is not a straight line; it varies with frequency in a curve the eye actually measures. CIE TN 006, published in 2016, set out the visual aspects of time-modulated lighting and defined the temporal light artefacts, and it provided the framework for a new generation of metrics built on a flickermeter model of the human visual system rather than a hand-drawn boundary.
PstLM is the short-term light-flickermeter indicator, the objective method standardized in IEC TR 61547-1. It runs the measured light waveform through a model of the eye's frequency response and returns a single number. The calibration is the important part: PstLM equal to 1 means an average observer has roughly a 50 percent probability of detecting the flicker, values below 1 are progressively less visible, and values above 1 are increasingly obvious. The European Ecodesign Regulation 2019/2020 took this metric into law, requiring PstLM at or below 1.0 for light sources placed on the EU market, with a defined set of exemptions. For product sold into Europe, PstLM is the number that actually matters, not the IEEE 1789 chart.
SVM, the stroboscopic visibility measure, addresses the artefact the other metrics miss, the stroboscopic effect seen on moving objects, standardized in IEC TR 63158. It is calibrated in the same way, with SVM equal to 1 as the visibility threshold for an average observer. The European regulation then converts that scale into a binding functional requirement rather than a disclosure one. Under Annex II, LED and OLED light sources at full load must hold SVM at or below 0.4, alongside PstLM at or below 1.0, with stated exemptions for high-output HID above roughly 4000 useful lumens and for sources intended for outdoor, industrial or other applications where the relevant standards allow a CRI below 80. The number 0.4 is the cap a product actually has to meet for the EU; the SVM equal to 1 figure is only the perception threshold the scale is calibrated against, not the legal limit.
PstLM and IEEE 1789 are not rivals, and neither has replaced the other. IEEE 1789 gives a designer a fast, intuitive picture of where a product sits and a clear route - raise the frequency - while PstLM gives a regulator a perception-based number that can be written into a limit. DLC programs likewise require flicker testing and reporting, with Premium tiers demanding continuous dimming and tighter handling of temporal light artefacts. California's Title 24 JA8 defines its own reduced-flicker operation for high-efficacy residential sources as percent flicker below 30 percent at frequencies below 200Hz, measured at full output and again when dimmed to 20 percent under test method JA-10. That line is looser than the European one, but it is notable for forcing a test at a dimmed state rather than at full output alone. A well-documented product publishes all of them: percent flicker, flicker index, modulation frequency, and PstLM with SVM where the market calls for it.
5. Where flicker comes from: the driver, and how dimming changes it
Once a design is fixed, the LED chips do not modulate on their own; the driver sets the current and the light follows. This is why two products built around the same LED can sit at different flicker levels, and it is why the driver specification deserves more attention than the chip brand when flicker is the concern. A handful of configurations are the repeat offenders, and naming them is the quickest way to spot risk.
AC LEDs that rectify the mains on board can leave a large line-frequency ripple. DC LEDs on inexpensive drivers with small or inadequate output capacitors let the residual ripple reach the diodes. Integral lamps on cheap electronic transformers, common in low-voltage retrofit situations, can introduce their own modulation. Phase-cut TRIAC dimming chops the mains waveform and asks the driver to reconstruct a smooth current from a moving conduction angle, a job cheap drivers handle poorly. And PWM dimming switches the current fully on and off at some frequency, which by definition introduces modulation at that frequency, at a depth that approaches 100 percent.
The consistent pattern across all of these is that dimming makes flicker worse. At full brightness a phase-cut driver sees the full waveform and can deliver a steady current; at low brightness the conduction angle is small, the hold current is marginal, and the driver may drop out, recover and drop out again, producing visible stepping and stroboscopic modulation. A PWM signal at low duty cycle spends most of its time off, which drives depth up. The product that is clean at full output can be the worst offender on the dimmer at the bottom of its range. A claim of flicker free measured only at full brightness is close to meaningless.
The design routes that avoid this are not exotic. High-frequency constant-current drivers with enough output capacitance smooth the ripple to a low level. Where PWM is used, moving the switching frequency above the visual thresholds - the standard's 1250Hz region and, for camera and phantom-array work, higher still - keeps it out of the region the eye and sensors sample. Analog or current-amplitude dimming, which holds the current steady and varies its level rather than pulsing, avoids the modulation that PWM creates but brings its own color-shift and thermal trade-offs. The honest engineering sentence is this: getting flicker-free light at full brightness is a commodity; keeping it flicker free through the entire dimming range, without steps, dropouts or audible noise, is the capability worth specifying and testing.
6. How to actually verify flicker instead of trusting a label
The two words flicker free appear on a great many datasheets, and there is no single legal definition behind them. A manufacturer can use the phrase for a product that merely passes at full output. The standards groups have been explicit that the waveform and the metrics are what matter, so the buyer's job is to obtain a measurement rather than accept the label.
In a lab the measurement is made on the light output, not on the electrical current. A photometric probe or photodiode is pointed at the LED board or strip, and its output is fed to an oscilloscope or a waveform acquisition system that displays the optical waveform - the light itself over time. From that trace the modulation frequency and the maximum and minimum levels are read and percent flicker and flicker index are calculated. A dedicated flicker meter, such as the instruments built to the IEC and CIE methods, performs the same capture and reports PstLM and SVM directly. Measuring the optical waveform rather than the drive current matters because the two can differ; some ripple in the current is filtered by the LED and the phosphor, and some is not, and only the light tells you which.
The test must be repeated across the dimming range, not run once at full brightness. A practical sequence measures at full output, at a middle level, and at the lowest stable level, and on any control protocol the product ships with - phase-cut, 0-10V, DALI or PWM. The numbers commonly deteriorate toward the bottom, and a single-point certificate hides exactly where. The report should include the conditions, the optical waveform, the frequencies and the metric values at each point.
For quick, comparative checks in the field there are older tools that are worth knowing and equally worth not over-trusting. A flicker wheel or a spinning top marked with a pattern appears to freeze or split into spokes under modulation, giving a pass/fail-style indication; the phone-camera test looks for rolling bands and is sensitive to modulation, but the result depends on the camera and the shutter setting, so two products can be compared on the same phone but no metric can be read from it; waving the fingers through the beam or sweeping the eyes across the source reveals the phantom array. None of these is quantitative. They are screening tools, and anything that matters should be measured on a probe.
Anywhere the light is filmed deserves a tighter standard. A video or still camera samples the scene at a frame rate and a shutter speed that can alias against modulation the human eye simply averages away, so a space that looks fine in person can show bands or strobe on a recording, a video call or a broadcast. Studios, conference rooms and any site that produces video should be specified and verified with a camera present as well as a meter, not against the eye alone. The request to a factory follows directly: provide the flicker test report with percent flicker, flicker index, modulation frequency and PstLM/SVM, the optical waveform, and confirmation that the measurements were taken across the dimming range and on the named driver.
7. Where flicker matters most, and where it barely matters
Not every space needs the strictest number, and spending the budget uniformly is a mistake. The standards and the application guidance point to a clear hierarchy, driven by how long people stay, how close the task is, and whether the light is recorded. The high-priority list is the set of spaces where people read, focus or work for hours: hospitals and clinics, classrooms and nurseries, offices, task lighting at desks and workbenches, and any environment used by groups that may include sensitive individuals.
Spaces that are recorded form their own category: television studios, video and photography locations, and conference and meeting rooms running cameras. These need tighter control than the eye alone would demand because the sampling is harsher. Treating video spaces as ordinary office lighting is a recurring source of problems that only surface on the first recording.
At the other end are the spaces where the guidance relaxes. Roadway and parking-light lighting, outdoor high-output installations where movement dominates and the eye is not held on a task, small accent points on artwork, very low-intensity decorative lighting, and high-bay sports or industrial lighting on three-phase systems are all areas where the standard's concern is lower. A three-phase system also overlaps the three line cycles, which can average residual modulation on its own. The point is not that flicker is irrelevant there, but that the engineering budget is better spent on the spaces people actually occupy and look at.
Writing the hierarchy down keeps a project honest: apply the no-effect-level numbers where sensitive populations and long-duration tasks are involved, the low-risk line for general occupied spaces, and relaxed targets only where the application genuinely warrants it. Specifying the strictest limit everywhere is unnecessary cost; specifying it loosely everywhere is the more common and more expensive error.
8. What to write into the specification and the RFQ
Flicker is one of the easier things to control if it is specified before production and one of the harder things to fix after it, so it belongs in the written specification as a measured requirement, not a preference. The language that helps is the language with numbers behind it: the metric, the value, the conditions under which it was measured, and the document that proves it.
A usable spec asks for the following. A modulation frequency at or above 100Hz as the floor. PstLM at or below 1.0 and SVM at or below 0.4 for the EU market, and a tighter PstLM target - commonly 0.5 or 0.3 for premium or sensitive spaces - where the project warrants it. Percent flicker and flicker index stated explicitly rather than implied by the phrase flicker free. The PWM frequency, where PWM dimming is used, high enough to clear the visual and camera thresholds. Continuous dimming rather than stepped dimming for premium tiers. And a requirement that the values hold across the whole dimming range, with measurement at full, middle and minimum levels.
The market context decides which items are binding. EU-bound product needs PstLM at or below 1.0 and SVM at or below 0.4 at full load, with the correct exemptions applied; North American projects should align with the relevant California Title 24 high-efficacy requirements and DLC reporting where they apply; private projects can simply set a target and require the report. The factory can supply the driver and the optical measurements, but the importer or the project owner chooses which standard the numbers are judged against.
The supporting paperwork to request with the quote is short: a flicker test report carrying percent flicker, flicker index, modulation frequency and PstLM with SVM where required; the optical waveform trace; the driver and control protocol the test used; and confirmation of the dimming levels measured. A supplier that cannot produce these, or that offers only the phrase flicker free in place of them, is asking the buyer to carry the risk. The RFQ that lists these numbers alongside voltage, IP rating, color and quantity turns flicker into a like-for-like comparison, which is exactly what a specification is for.
Frequently asked questions
Questions buyers ask
What is IEEE 1789, and is it mandatory?
IEEE 1789 is the IEEE recommended practice for modulating current in high-brightness LEDs to mitigate health risks to viewers, released in 2015. It is engineering guidance, not a mandatory certification; there is no certificate or mark issued for it. It recommends a modulation frequency at or above 100Hz and percent flicker kept below a line that rises with frequency - at or below frequency times 0.08 for the general population and frequency times 0.0333 for the no-effect level that covers sensitive individuals. In the European Union the binding legal requirement is instead PstLM at or below 1.0 under Ecodesign Regulation 2019/2020, so for regulated markets PstLM is the number that matters.
What percent flicker is acceptable at 120Hz?
Applying the IEEE 1789 boundaries at 120Hz, the low-risk cap for the general population is 120 times 0.08, or 9.6, rounded up to about 10 percent. The stricter no-observable-effect level for sensitive populations is 120 times 0.0333, or roughly 4 percent. If the frequency cannot be measured reliably, the standard defaults to percent flicker at or below 10 percent. At the other end of the range, at 1250Hz or above, the low-risk line reaches 100 percent and the standard places no depth cap, which is why raising the modulation frequency is the usual design route.
What is the difference between percent flicker and flicker index?
Percent flicker is 100 times (maximum minus minimum) divided by (maximum plus minimum); it measures the peak-to-peak modulation on a 0 to 100 percent scale but does not account for waveform, duty cycle or frequency. Flicker index is an area ratio on a single cycle - the area above the average light level divided by the total area - running from 0 to 1, and it responds to the waveform and duty cycle but still ignores frequency. Because neither metric includes frequency, two products can print the same percent flicker and present different risk, which is why IEEE 1789 plots percent flicker against frequency rather than relying on a single number.
What is PstLM, and what value meets the European rules?
PstLM is the short-term light-flickermeter indicator defined in IEC TR 61547-1, built on a model of the human visual system. It is calibrated so that PstLM equal to 1 means the average observer has roughly a 50 percent chance of detecting the flicker, with lower values progressively less visible. European Ecodesign Regulation 2019/2020 sets two functional limits at full load for LED and OLED light sources: PstLM at or below 1.0 and SVM at or below 0.4, with defined exemptions for high-output HID and sources intended for outdoor, industrial or other applications where standards allow a CRI below 80. The SVM equal to 1 value is only the perception threshold; the legal cap is 0.4. A premium or sensitive-space project commonly specifies values tighter than these.
How do I test an LED product for flicker?
Measure the light output, not the drive current. In a lab a photometric probe or photodiode is pointed at the LED board and connected to an oscilloscope or a dedicated flicker meter, which displays the optical waveform and reports the modulation frequency, percent flicker, flicker index, and PstLM with SVM. The test is repeated at full, middle and minimum dimming levels, because flicker usually worsens as the light is dimmed. Quick field checks - a flicker wheel or spinning top, a phone camera, or waving fingers under the light to reveal the phantom array - are comparative screening tools, not quantitative measurements, and anything filmed for video or conferencing should be verified with a camera present as well as a meter.
Talk to the product team
Planning an OEM or commercial lighting order?
Send your application, specification and destination market. We will help narrow the product and sample options.
Discuss on WhatsApp